
Introduction: The Digital Frontline of a Global Crisis
n
At the height of the SARS-CoV-2 pandemic, the world became obsessed with dashboards. From the flickering red dots of the Johns Hopkins University (JHU) map to the complex policy matrices of the Oxford COVID-19 Government Response Tracker (OxCGRT), data became the primary lens through which humanity viewed its survival. As of 2024, the landscape of this data has shifted dramatically. What was once a real-time battle map has transitioned into a historical archive and a streamlined weekly monitoring system.
n
The recent updates to global COVID-19 tracking platforms signify a pivotal moment in public health history. As major institutions like JHU cease their resource centers and researchers sunset their policy-tracking initiatives, the responsibility for maintaining the global record has consolidated. This transition reflects a world moving from "emergency response" to "endemic management," yet the data remaining provides a crucial blueprint for future pandemic preparedness.
n
Main Facts: The Current State of Global Monitoring
n
The primary mechanism for tracking COVID-19 today focuses on two distinct but interrelated streams: epidemiological data (cases and deaths) and policy interventions (government mandates and economic relief).
n
The Shift in Epidemiological Oversight
n
As of March 7, 2023, the global standard for COVID-19 case and death reporting transitioned fully to the World Health Organization’s (WHO) Coronavirus Dashboard. This move followed the closure of the Johns Hopkins University Coronavirus Resource Center on March 10, 2023—a facility that had served as the world’s most cited data source for three years. Current trackers provide a rolling 200-day window of data to ensure platform stability, though historical datasets dating back to 2020 remain accessible for researchers via repositories like GitHub.
n
The Sunset of Policy Tracking
n
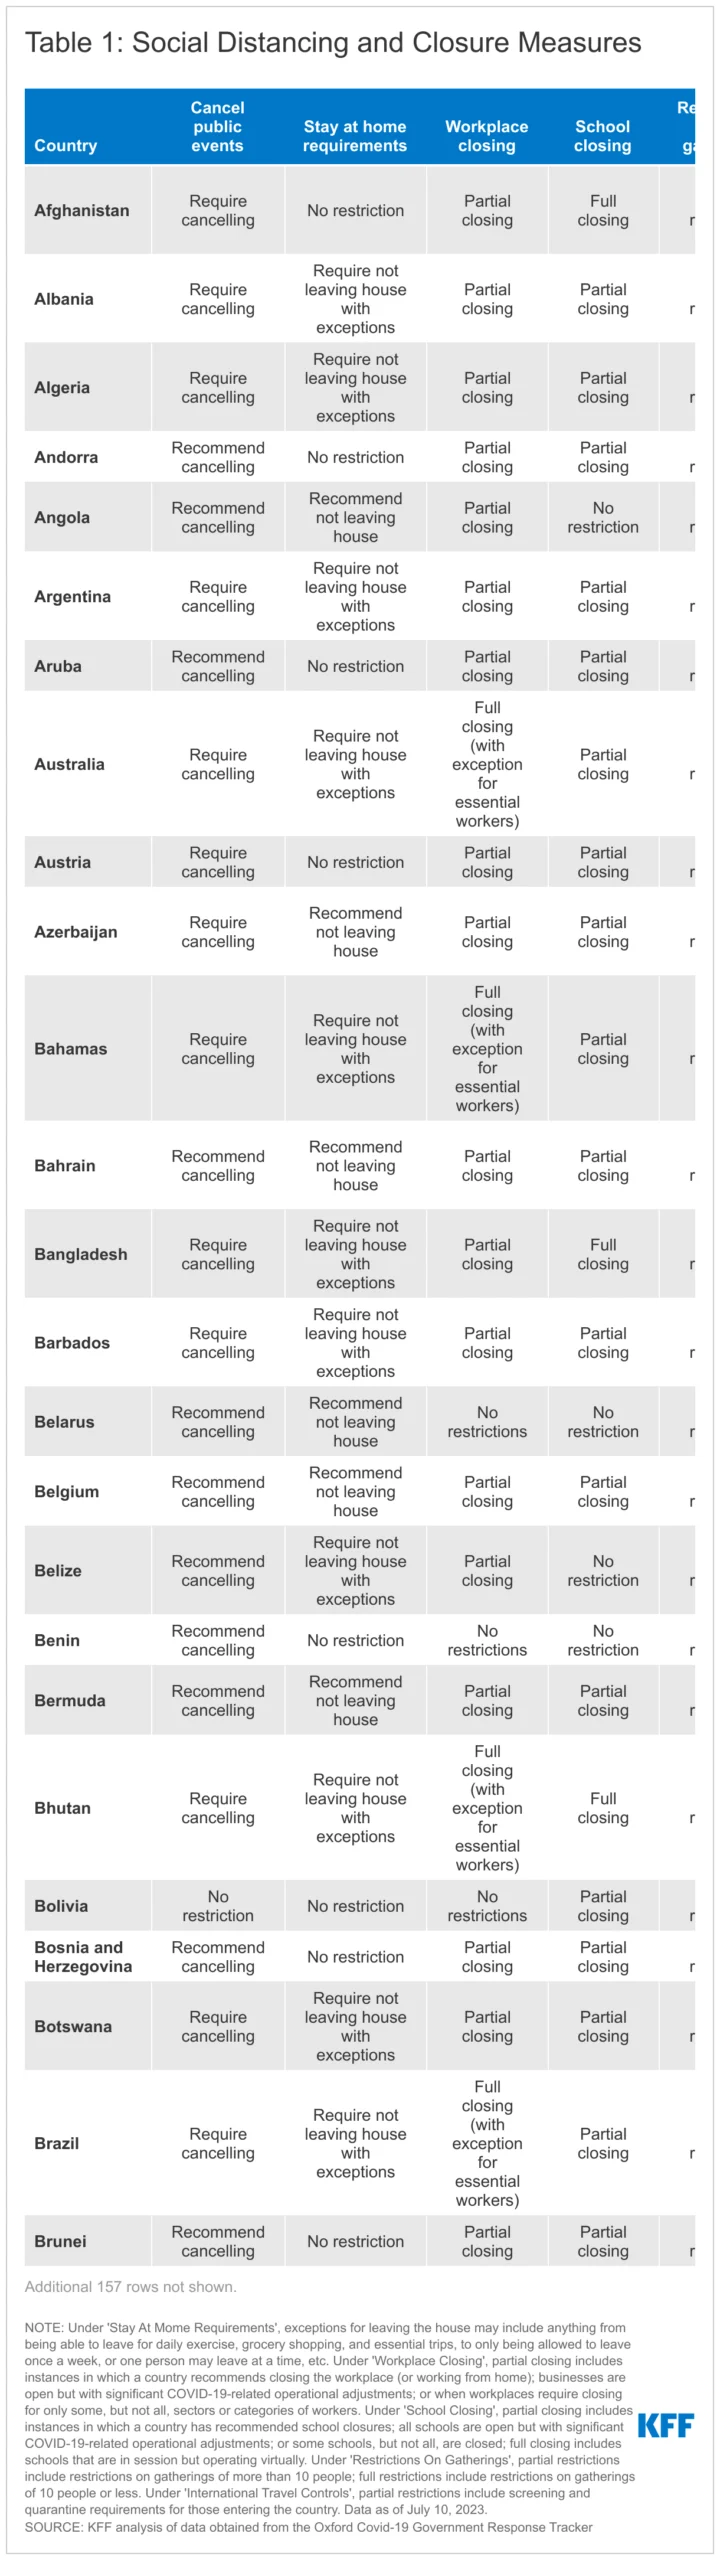
Perhaps the most significant change in the data landscape is the cessation of the Policy Actions tracker. For the duration of the crisis, policy trackers categorized government responses into three main pillars:
n
- n
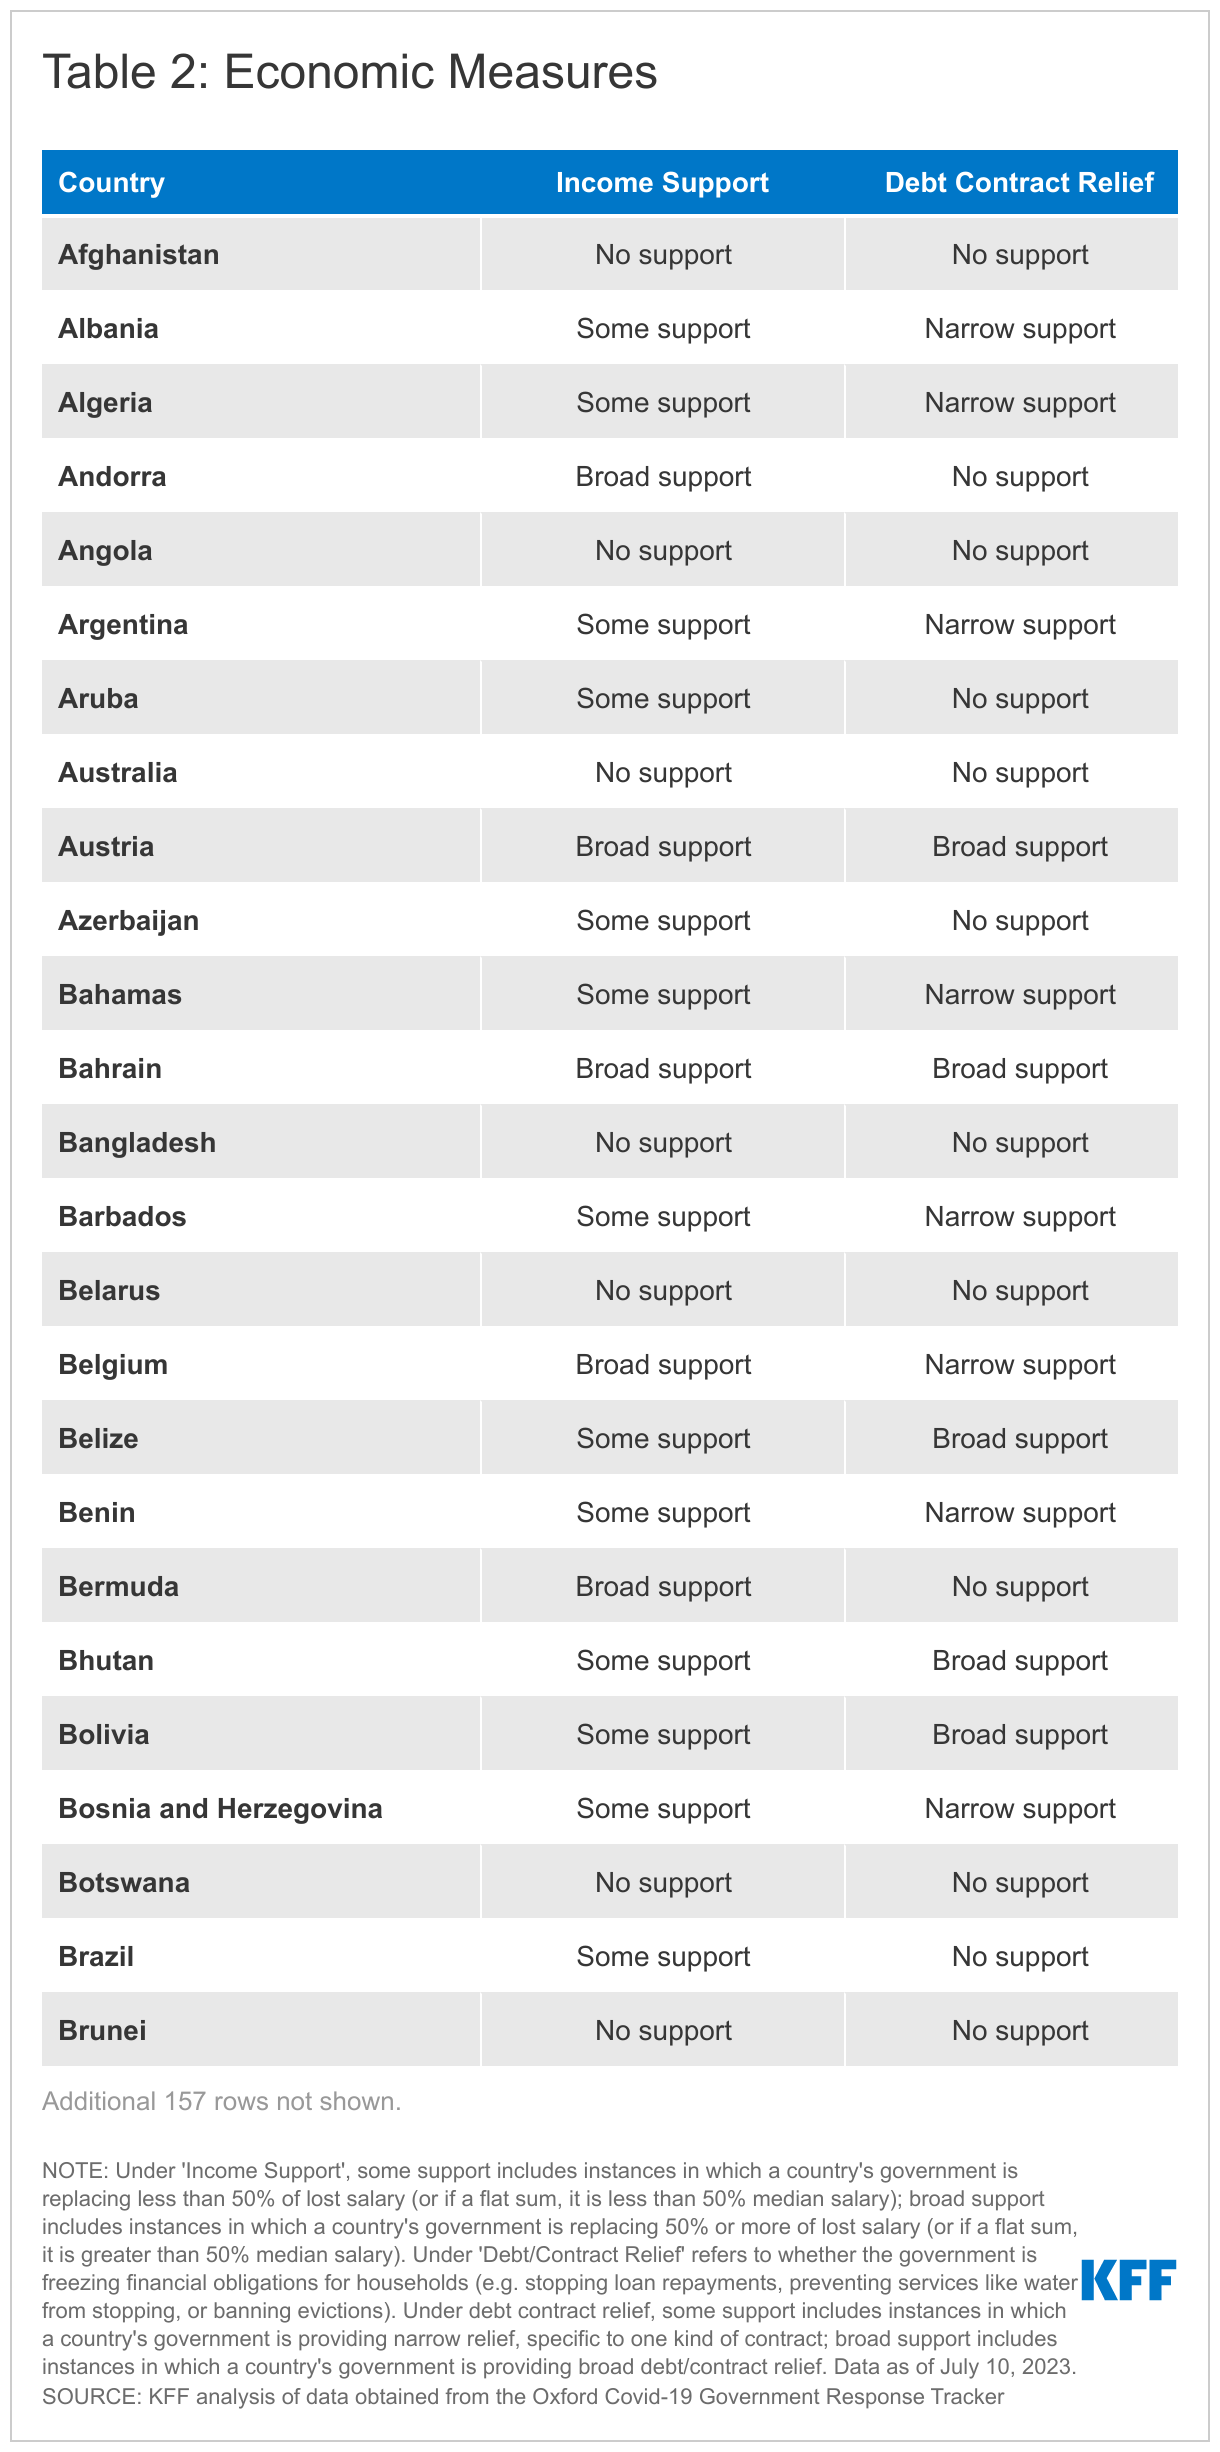
- Social Distancing and Closure Measures: School closures, workplace restrictions, and stay-at-home orders.
- Economic Measures: Income support and debt relief programs.
- Health Systems Measures: Vaccine eligibility and facial covering mandates.
n
n
n
n
Because the Oxford Covid-19 Government Response Tracker (OxCGRT)—the primary data engine for these insights—ceased updating its global database at the end of 2022, the policy landscape now exists as a "frozen" dataset, representing the final state of global mandates as the world entered 2023.
n
Chronology: From Real-Time Crisis to Historical Record
n
The timeline of COVID-19 data tracking reveals a gradual tapering of urgency, reflecting the global community’s evolving relationship with the virus.
n
- n
- 2020–2022: The Era of Hyper-Reporting. During this period, data was updated daily. The JHU map was the gold standard, and the Oxford Tracker meticulously logged every change in local mandates, from municipal mask requirements to national lockdowns.
- December 31, 2022: The Policy Freeze. The Oxford COVID-19 Government Response Tracker officially ceased updating. This marked the point where many governments stopped issuing new pandemic-specific mandates, instead integrating COVID-19 management into general public health frameworks.
- March 7–10, 2023: The Great Transition. The JHU Resource Center, citing a change in how states and countries report data, shuttered its doors. The WHO became the sole primary aggregator of global case and death statistics.
- March 18, 2024: Technical Correction. A significant update was made to modern tracking tools to clarify that data points represent new cases and deaths over a full week rather than a daily average. This change highlights the move toward longitudinal monitoring rather than day-to-day fluctuations.
n
n
n
n
n
Supporting Data: Defining the Metrics of Response
n
To understand the impact of the pandemic, one must look at how "response" was quantified. The methodology behind these trackers used specific definitions to categorize the severity of government actions.
n
Social Distancing and Closure Nuances
n
Trackers did not merely list "open" or "closed." They utilized a "partial vs. full" binary to capture the complexity of the global response:
n
- n
- Workplace Closings: "Partial" meant recommendations to work from home or closures limited to specific high-risk sectors (like hospitality), while "Full" meant mandatory closures for all non-essential businesses.
- School Closures: This category was particularly nuanced. "Partial" closures included regions where only certain grade levels were affected or where schools were open but with significant operational shifts. "Full" closures notably included schools that remained "in session" but were forced into 100% virtual learning environments.
- Stay-at-Home Requirements: These ranged from "recommendations" to strict "lockdowns" where citizens could only leave for essential groceries or medical emergencies.
n
Economic Support Metrics
The economic data tracked how nations cushioned the blow of lockdowns.
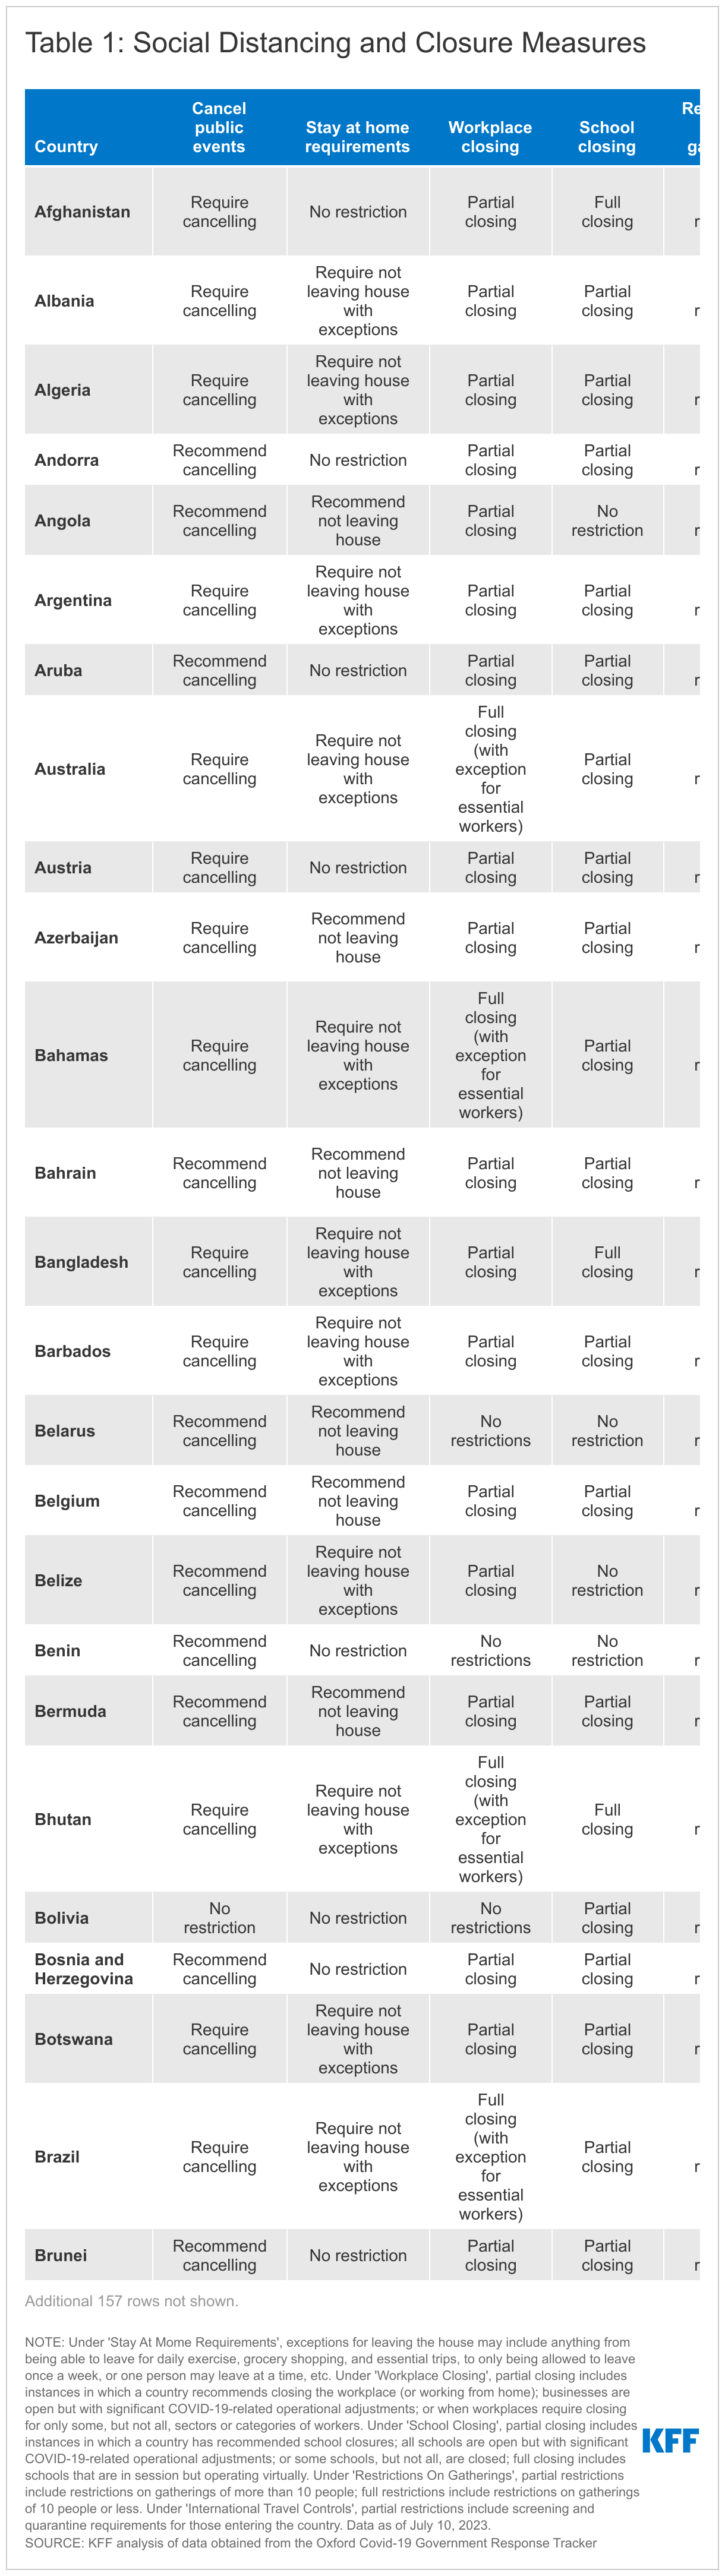
- Income Support: "Broad support" was defined as a government replacing 50% or more of a worker’s lost salary. "Narrow support" covered anything less.
- Debt Relief: This tracked whether governments mandated moratoria on mortgage payments or utility bills, providing a window into which nations prioritized consumer protection during the downturn.
Health System Adaptations
Health data focused heavily on the rollout of preventative measures.
- Vaccine Eligibility: Trackers monitored the transition from "priority group" availability (elderly and healthcare workers) to "universal" availability.
- Facial Coverings: This metric evolved from "recommended" to "required in all public spaces," eventually receding to "required in high-risk settings" (like hospitals) before being phased out in most jurisdictions.
Official Responses and Methodological Integrity
The maintenance of these trackers relies on a complex web of international cooperation. Data integrity is managed through several key institutional frameworks:
- The World Health Organization (WHO): Now the primary source for epidemiological data, the WHO relies on member states to report their figures. However, the WHO acknowledges a "two-week lag" in reporting, a necessary buffer to ensure that data from developing regions or decentralized health systems is accurately captured.
- The United Nations (UN): Population data used to calculate "rates per 100,000" are drawn from the UN World Population Prospects (2021 estimates). This ensures that the severity of the pandemic is measured relative to a country’s size, preventing larger nations from appearing disproportionately affected compared to smaller, high-density areas.
- The World Bank: Income-level classifications (High, Middle, Low) are sourced from the World Bank. This allows analysts to correlate pandemic outcomes with national wealth, revealing the stark "vaccine gap" and the disparity in economic relief capabilities between the Global North and South.
Implications: Why the "Data Desert" Matters
The cessation of real-time policy tracking and the shift to weekly reporting have significant implications for public health, sociology, and future governance.
The Loss of Granularity
By moving to weekly reporting and ending the tracking of specific policy actions, the world is entering what some experts call a "data desert." While the emergency has passed, the ability to correlate a specific policy (like a mask mandate in a specific month) with a specific drop in cases becomes harder as the data is aggregated into larger chunks. This makes "post-game" analysis of which policies worked best more difficult for future historians.
The Shift to Endemicity
The 2024 correction—clarifying that figures represent weekly totals rather than daily averages—is a symbolic acknowledgment that COVID-19 is now part of the "background noise" of global health. Much like the flu, the focus has shifted from tracking every individual infection to monitoring broad trends that might signal a new variant of concern.
Lessons for Future Pandemics
The legacy of these trackers is the creation of a "Digital Library of Crisis." By documenting how every country on earth responded—economically, socially, and medically—we have a massive dataset that can be used to model future responses. The Oxford Tracker, though no longer updated, remains the most comprehensive record of how human liberty and economic activity were adjusted in the face of a biological threat.
Conclusion: The Value of the Archive
While the "Policy Actions" tracker will no longer provide updates, its existence remains a testament to the unprecedented transparency of the 2020-2023 era. The transition to the WHO dashboard and the maintenance of GitHub repositories ensure that the lessons learned during the COVID-19 pandemic are not lost.
As we look at the data today, we see a world that has largely dismantled its emergency infrastructure but remains vigilant. The trackers have served their purpose as active tools of war; they now serve as the maps for the peace that followed, providing the necessary evidence to ensure that when the next "Disease X" arrives, the world does not have to start its calculations from zero.

