
As international health organizations transition from emergency response to long-term management, the tools used to monitor COVID-19 cases, deaths, and government interventions are undergoing a significant transformation, signaling a new chapter in global public health accountability.
n
Main Facts: The State of Global COVID-19 Monitoring
n
The landscape of global pandemic tracking has reached a critical juncture. For three years, the world relied on a patchwork of academic and governmental databases to navigate the complexities of the SARS-CoV-2 outbreak. However, recent updates to major tracking platforms indicate a shift toward consolidated, albeit less frequent, reporting.
n
Currently, the primary mechanism for monitoring the pandemic’s trajectory has shifted its reliance to the World Health Organization (WHO) Coronavirus (COVID-19) Dashboard. This transition, which occurred in March 2023, marked the end of an era for the Johns Hopkins University (JHU) Coronavirus Resource Center—a platform that had become the gold standard for real-time data since the pandemic’s inception.
n
The data now provided by these trackers offers a comprehensive look at the cumulative number of confirmed cases and deaths, as well as weekly rates categorized by country, income level, and region. Despite the stabilization of many global health systems, the data continues to show the lingering impact of the virus, though with a notable two-week reporting lag. Furthermore, a significant component of pandemic monitoring—the tracking of government policy responses—has officially ceased. The Oxford COVID-19 Government Response Tracker (OxCGRT), which monitored everything from school closures to debt relief, has ended its data collection, leaving a historical record that concludes at the end of 2022.
n
Chronology: From Emergency Tracking to Historical Archiving
n
The timeline of COVID-19 data collection reflects the broader trajectory of the pandemic itself, moving from chaotic real-time updates to a more standardized, retrospective analysis.
n
The JHU Era (January 2020 – March 2023)
n
In the early days of the pandemic, the Johns Hopkins University Coronavirus Resource Center provided the most visible and cited data visualization in the world. It served as a vital tool for policymakers and the public alike. However, as reporting requirements changed and many jurisdictions shifted from daily to weekly reporting—or ceased reporting altogether—the feasibility of maintaining a real-time, volunteer-led map diminished. The JHU tracker officially ended its operations on March 10, 2023.
n
The WHO Transition (March 2023 – Present)
n
On March 7, 2023, major tracking entities shifted their primary data source to the WHO. This move was intended to ensure data integrity by utilizing official government-reported figures vetted by the United Nations’ health agency. This period also saw a shift in how data was presented; instead of daily snapshots, the focus moved to "new cases and deaths over a full week," a metric corrected in March 2024 to provide a clearer picture of viral trends without the "noise" of daily reporting fluctuations.
n
The Cessation of Policy Tracking (Late 2022 – 2024)
n
While biological data (cases and deaths) continues to be updated, the tracking of human behavior and government mandates has hit a full stop. The Policy Actions tracker, which utilized data from the Blavatnik School of Government at Oxford, ceased updates as governments moved away from emergency mandates. The final data points for social distancing, economic support, and health system measures were solidified as of the end of 2022.
n
Supporting Data: Analyzing the Pillars of Pandemic Response
n
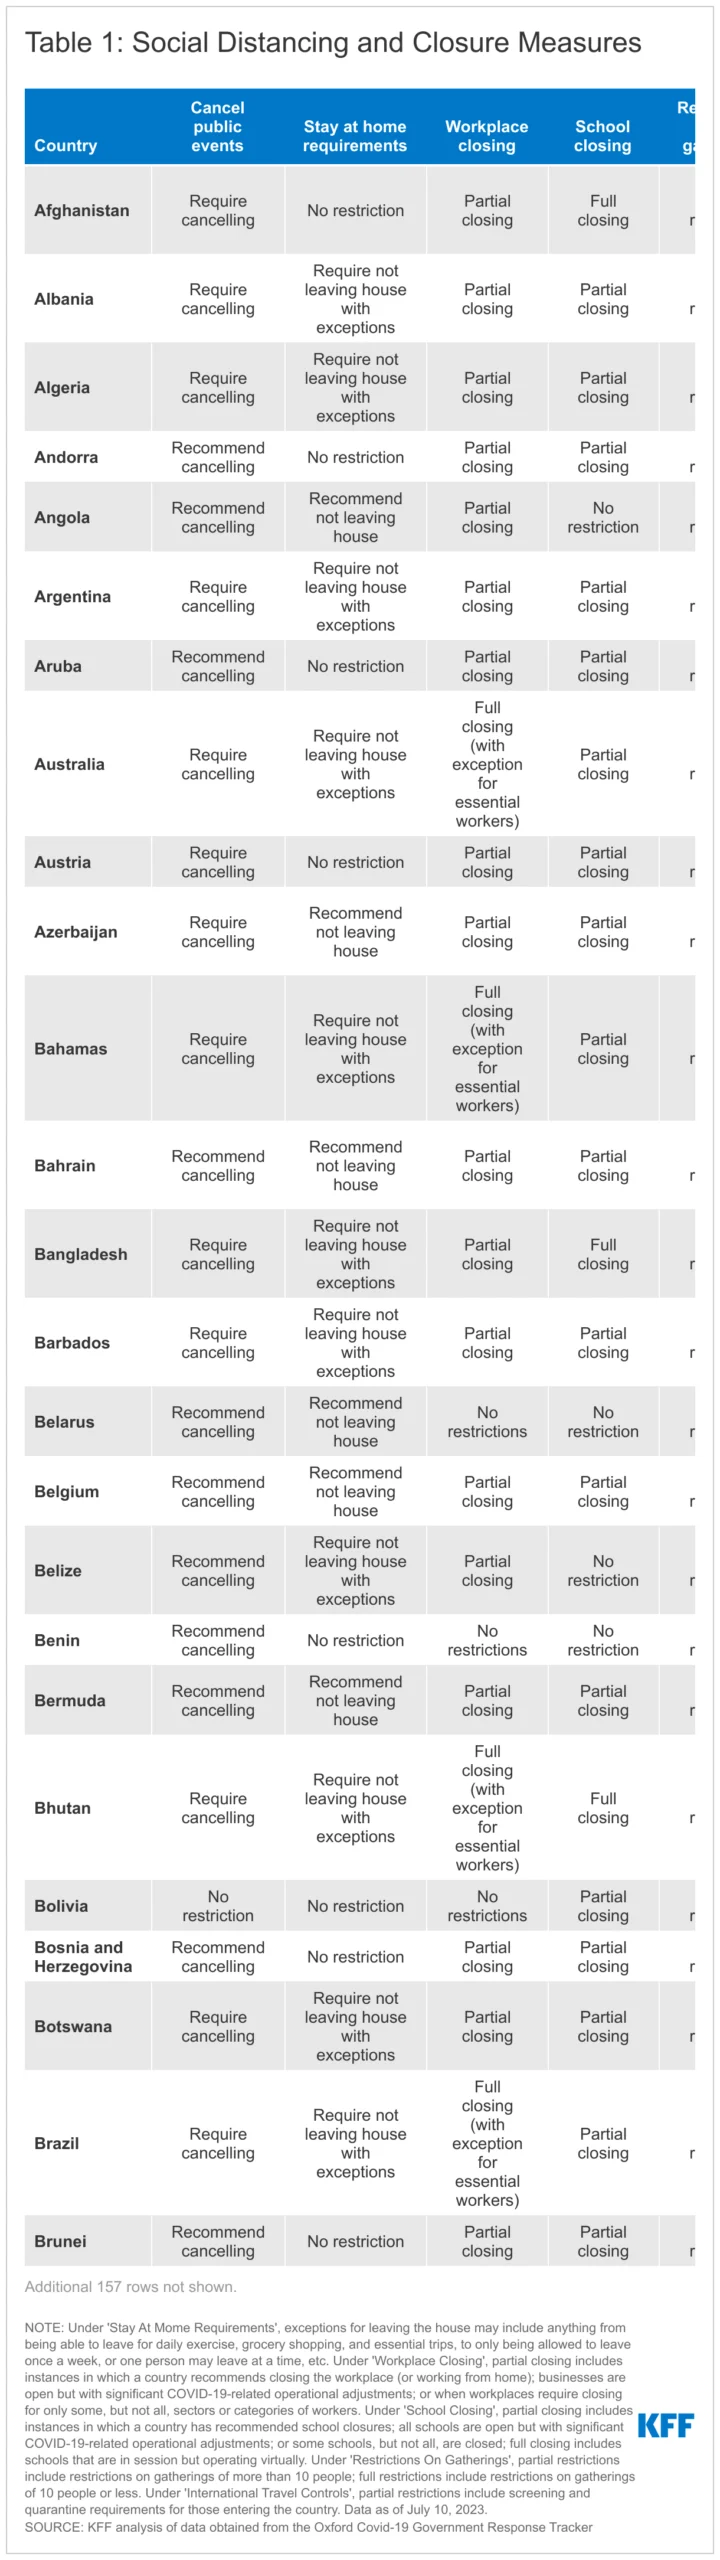
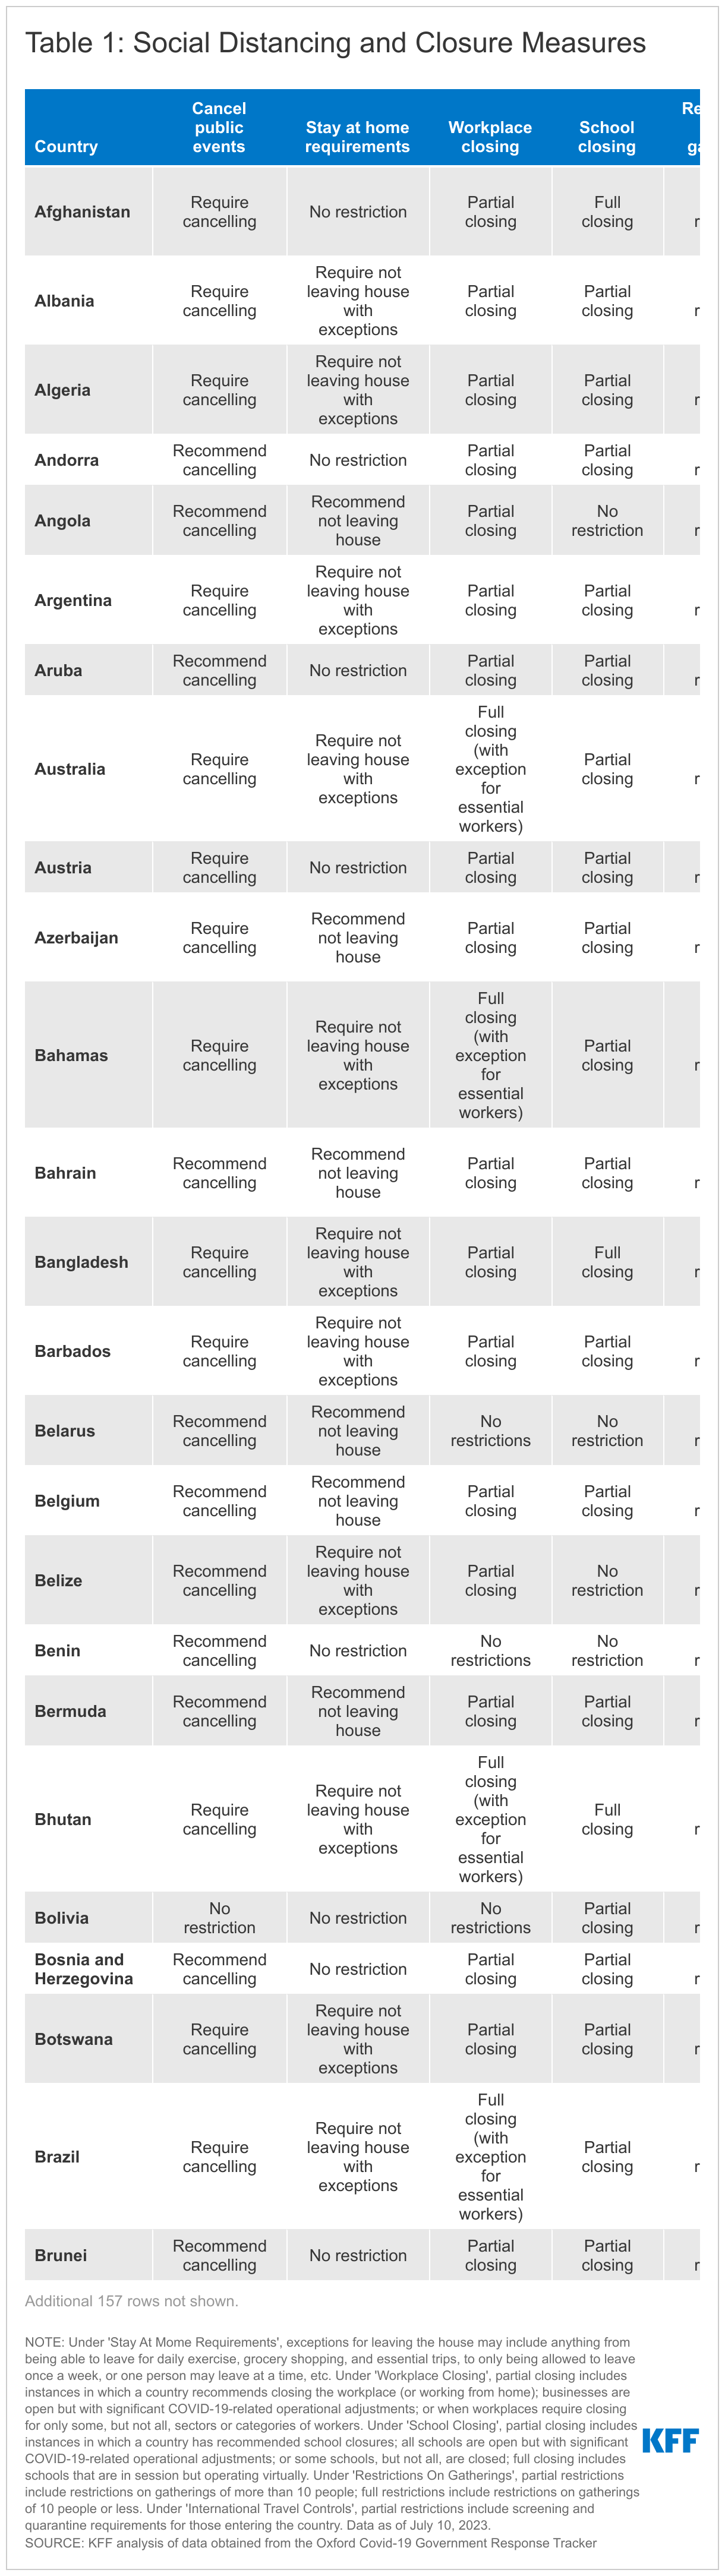
To understand the scope of the global response, it is necessary to examine the three primary categories of policy actions that defined the pandemic era: social distancing, economic measures, and health system interventions.
n
1. Social Distancing and Closure Measures
n
These were the most visible and controversial of all government interventions. They included:
n
- n
- Stay-at-Home Requirements: These ranged from strict lockdowns to "recommendations." Even under strict requirements, exceptions were often carved out for essential trips, grocery shopping, or limited daily exercise.
- Workplace and School Closures: Data distinguishes between "partial" and "full" closures. A partial closure might involve only specific sectors (e.g., hospitality) or "operational adjustments" like hybrid learning. Full closures often meant a total pivot to virtual operations or complete cessation of activity.
- International Travel Controls: These evolved from total border closures to "partial restrictions," which primarily involved screening protocols and mandatory quarantine periods for incoming travelers.
n
n
n
n
2. Economic Measures: Mitigating the Strain
n
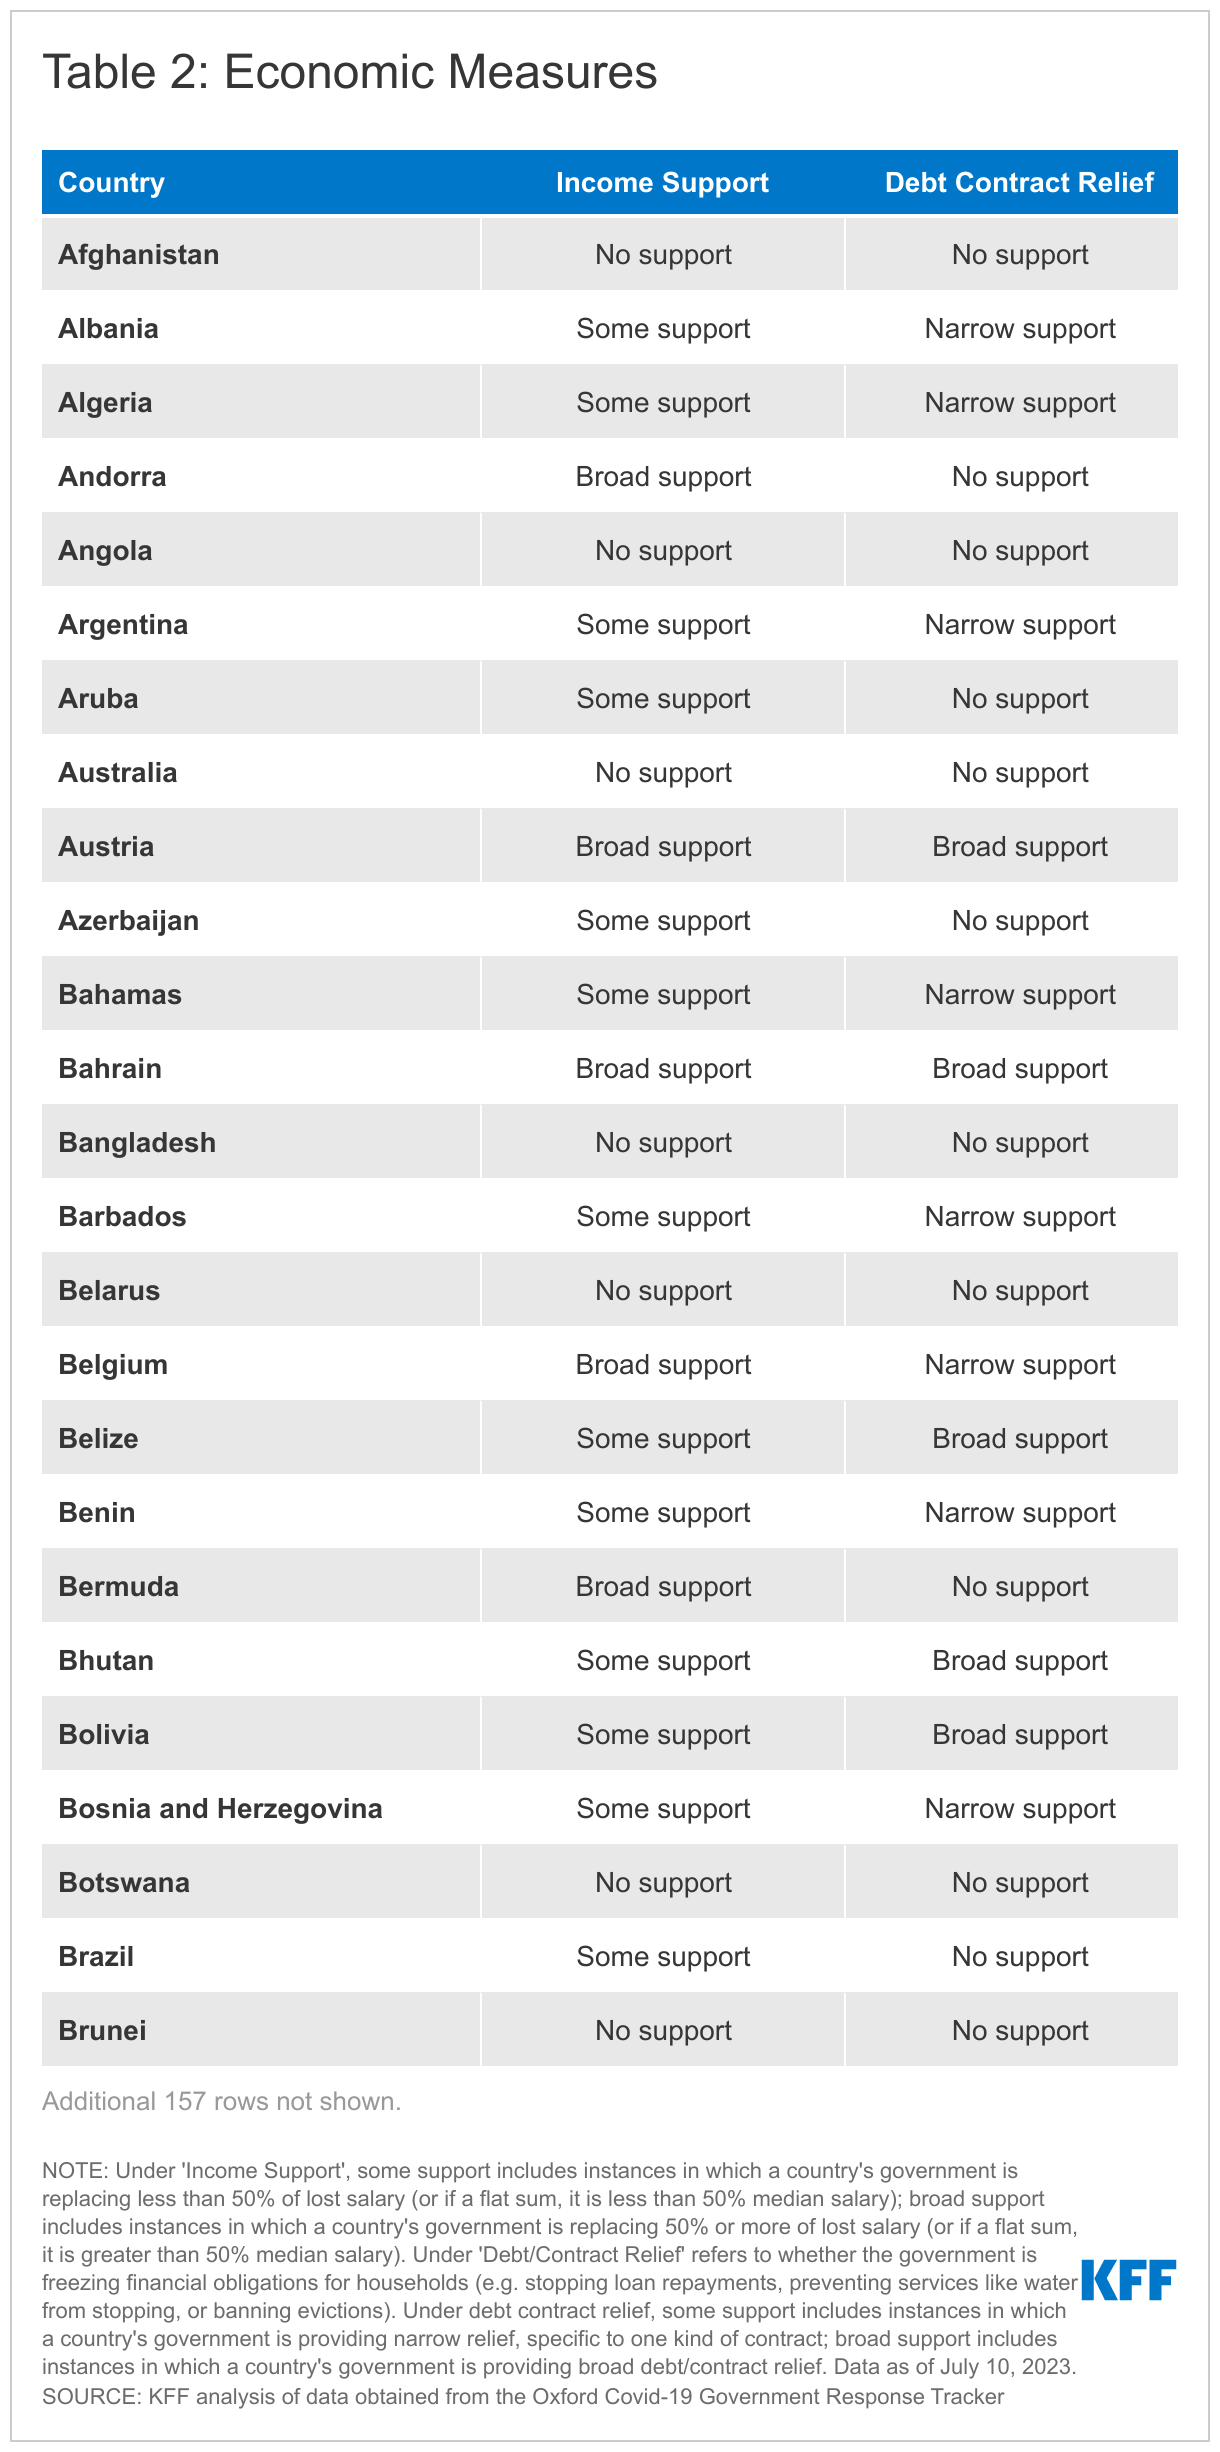
The pandemic placed an unprecedented strain on the global economy, forcing governments to implement massive fiscal interventions.
n
- n
- Income Support: This was categorized by the "depth" of support. "Broad support" involved governments replacing 50% or more of a worker’s lost salary, whereas "narrow support" covered less than half.
- Debt and Contract Relief: Governments also intervened in private contracts, providing relief for household debts, freezing evictions, or offering specific relief for utilities and business contracts.
n
n
n
3. Health Systems Measures: Strengthening the Frontline
n
As the virus mutated, health systems had to adapt their strategies for containment and protection.
- Vaccine Eligibility: This metric tracked the rollout from "partial availability" (targeting key workers and the elderly) to universal eligibility.
- Facial Coverings: Policies ranged from strict mandates in all public spaces to "recommendations" or requirements only in specific high-risk situations where social distancing was impossible.
Official Responses and Methodology
The reliability of pandemic data is heavily dependent on the methodologies employed by the reporting institutions. The current tracking framework utilizes a sophisticated blend of sources:
- World Health Organization (WHO): Serves as the primary source for case and death counts.
- United Nations World Population Prospects: Provides the 2021 population estimates used to calculate per capita rates, ensuring that data is comparable across countries of different sizes.
- World Bank: Provides the income-level classifications (Low, Middle, and High Income), which allow researchers to analyze how economic status influenced pandemic outcomes.
- Oxford COVID-19 Government Response Tracker (OxCGRT): Though now inactive, its codebook and interpretation guide remain the definitive resource for understanding how policy "stringency" was measured during the height of the crisis.
In a recent editorial note, trackers have clarified that while they provide the most recent data available, there is an inherent two-week lag. This delay is a result of the time required for local health departments to report to national governments, and for those governments to verify and transmit data to the WHO.
Implications: The Future of Global Health Surveillance
The winding down of active, daily trackers and the cessation of policy monitoring have significant implications for the future of global health.
First, the transition to the WHO as a sole source of truth centralizes data but also makes the global community dependent on the transparency of individual member states. If a country chooses to stop reporting or under-reports its numbers, there are fewer independent academic "checks" like the JHU tracker to provide an alternative view.
Second, the end of the Oxford Policy Tracker means that the world is losing a real-time window into how governments react to health crises. As "COVID fatigue" sets in and many countries treat the virus as endemic, the legislative frameworks that were built to handle the emergency are being dismantled. Without active tracking, it becomes harder to analyze which policies were most effective in real-time, should a new variant or a different pathogen emerge.
Third, the move to "weekly" rather than "daily" data—as clarified in the March 2024 correction—reflects a permanent shift in how we perceive public health threats. It suggests a move away from the "crisis mode" of 2020-2022 and toward a "monitoring mode," where long-term trends are valued over daily fluctuations.
Finally, the availability of the full dataset on platforms like GitHub ensures that while the trackers may no longer be updated daily, the "digital twin" of the pandemic is preserved for future generations. Historians, economists, and epidemiologists will likely spend decades mining this data to understand the most significant global disruption of the 21st century.
As the trackers go quiet, the focus shifts from what is happening now to what have we learned. The data suggests a world that is slowly closing the book on the emergency phase of COVID-19, even as the virus remains a permanent fixture of the global health landscape.

